
When are Home Prices Going to Come Down?
Ever since home values took off after COVID, I get some version of this question almost every week. Somebody stops me — at church, in line at the store, a neighbor catching me on the driveway — and they ask, "Maria, when are prices finally going to come down?" I had it happen again just this weekend, so I figured I'd share with you what I shared with him.
Here's the thing people remember: the last time prices ran up like this, they fell right off a cliff. So it's only natural to brace for the same thing. Surely it's coming again, right? We're now six years past the start of this run-up, and folks are still waiting for the other shoe to drop.
After 33 years in this business, I'll tell you straight — I can't tell you the when. Nobody honestly can. But I can show you the one chart that's made me look at this cycle differently.
Let's set the outliers aside
First, a little housekeeping. Let's put the outlier events off to the side for a minute. As a country we've gotten so used to the once-in-a-lifetime stuff that it barely feels rare anymore — but we still can't predict when those events will hit, or which direction they'll shove the market when they do.
Think about it: hardly anyone saw a global pandemic coming, let alone one that would have the government pumping roughly six trillion dollars into the system. That's $6,000,000,000,000. I bring that up on purpose, because that flood of money is exactly what makes this particular spike in home values so different from the last one.
Why this cycle isn't like the others
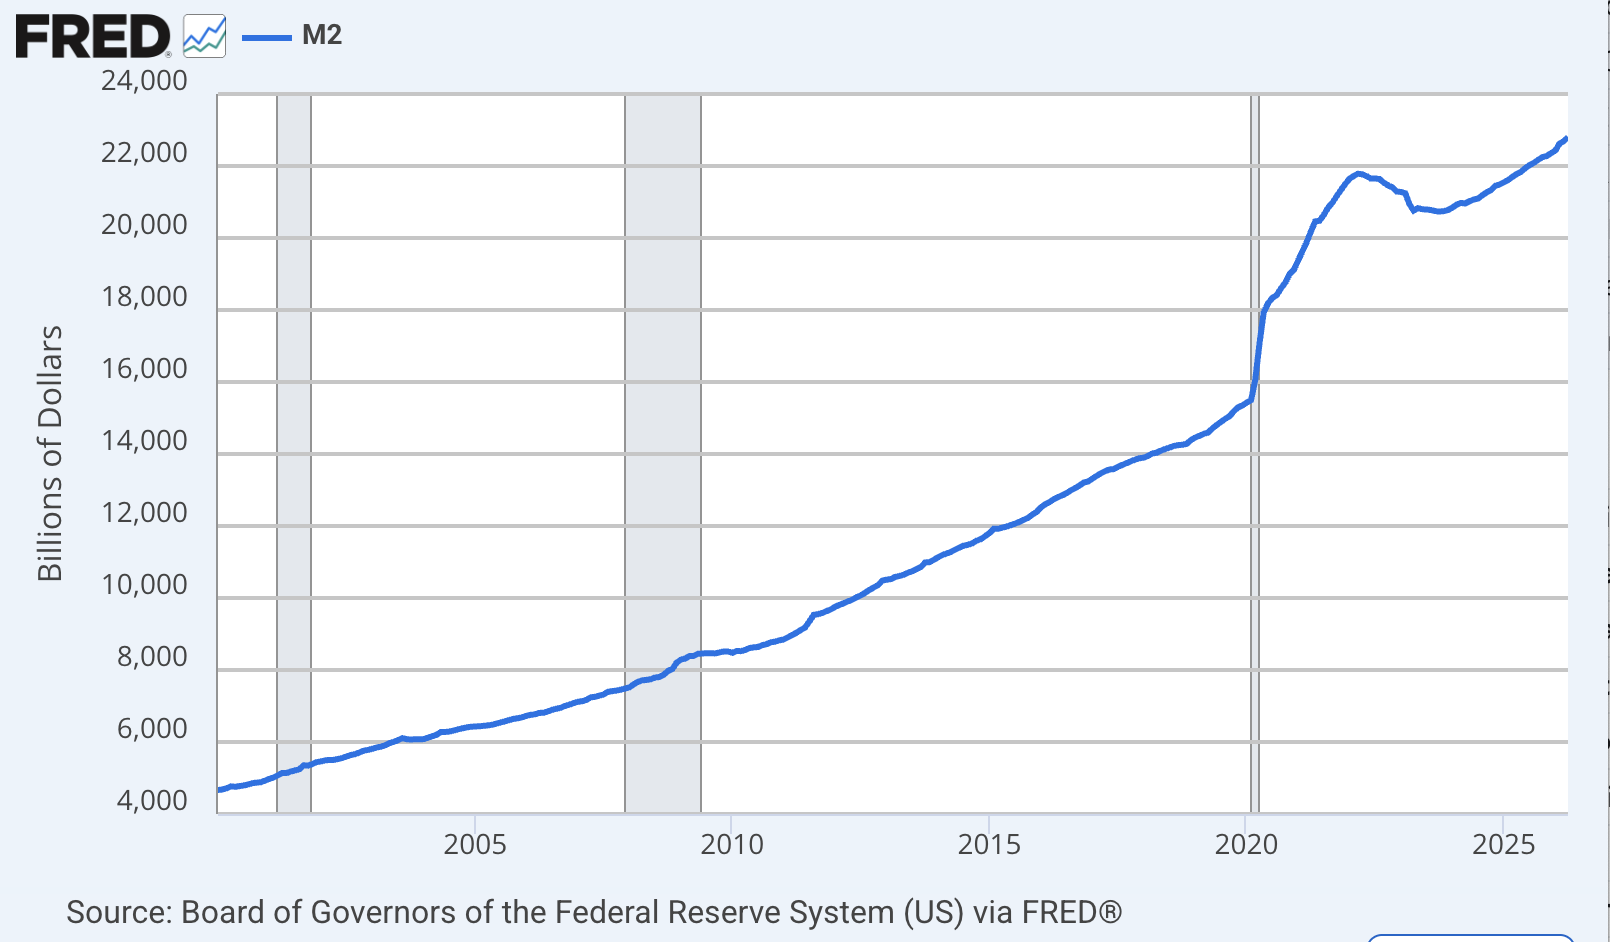
Now, I'm not a data geek by nature — I read people a lot better than I read spreadsheets. But every so often I like to pull up the FRED charts. They're a little out of date and usually too broad to be much use on a single house, but as a record of where we've been, they're solid. Today I want to look at one in particular: the money chart, the M2.
![Money supply as it relates to real estate — chart placeholder]
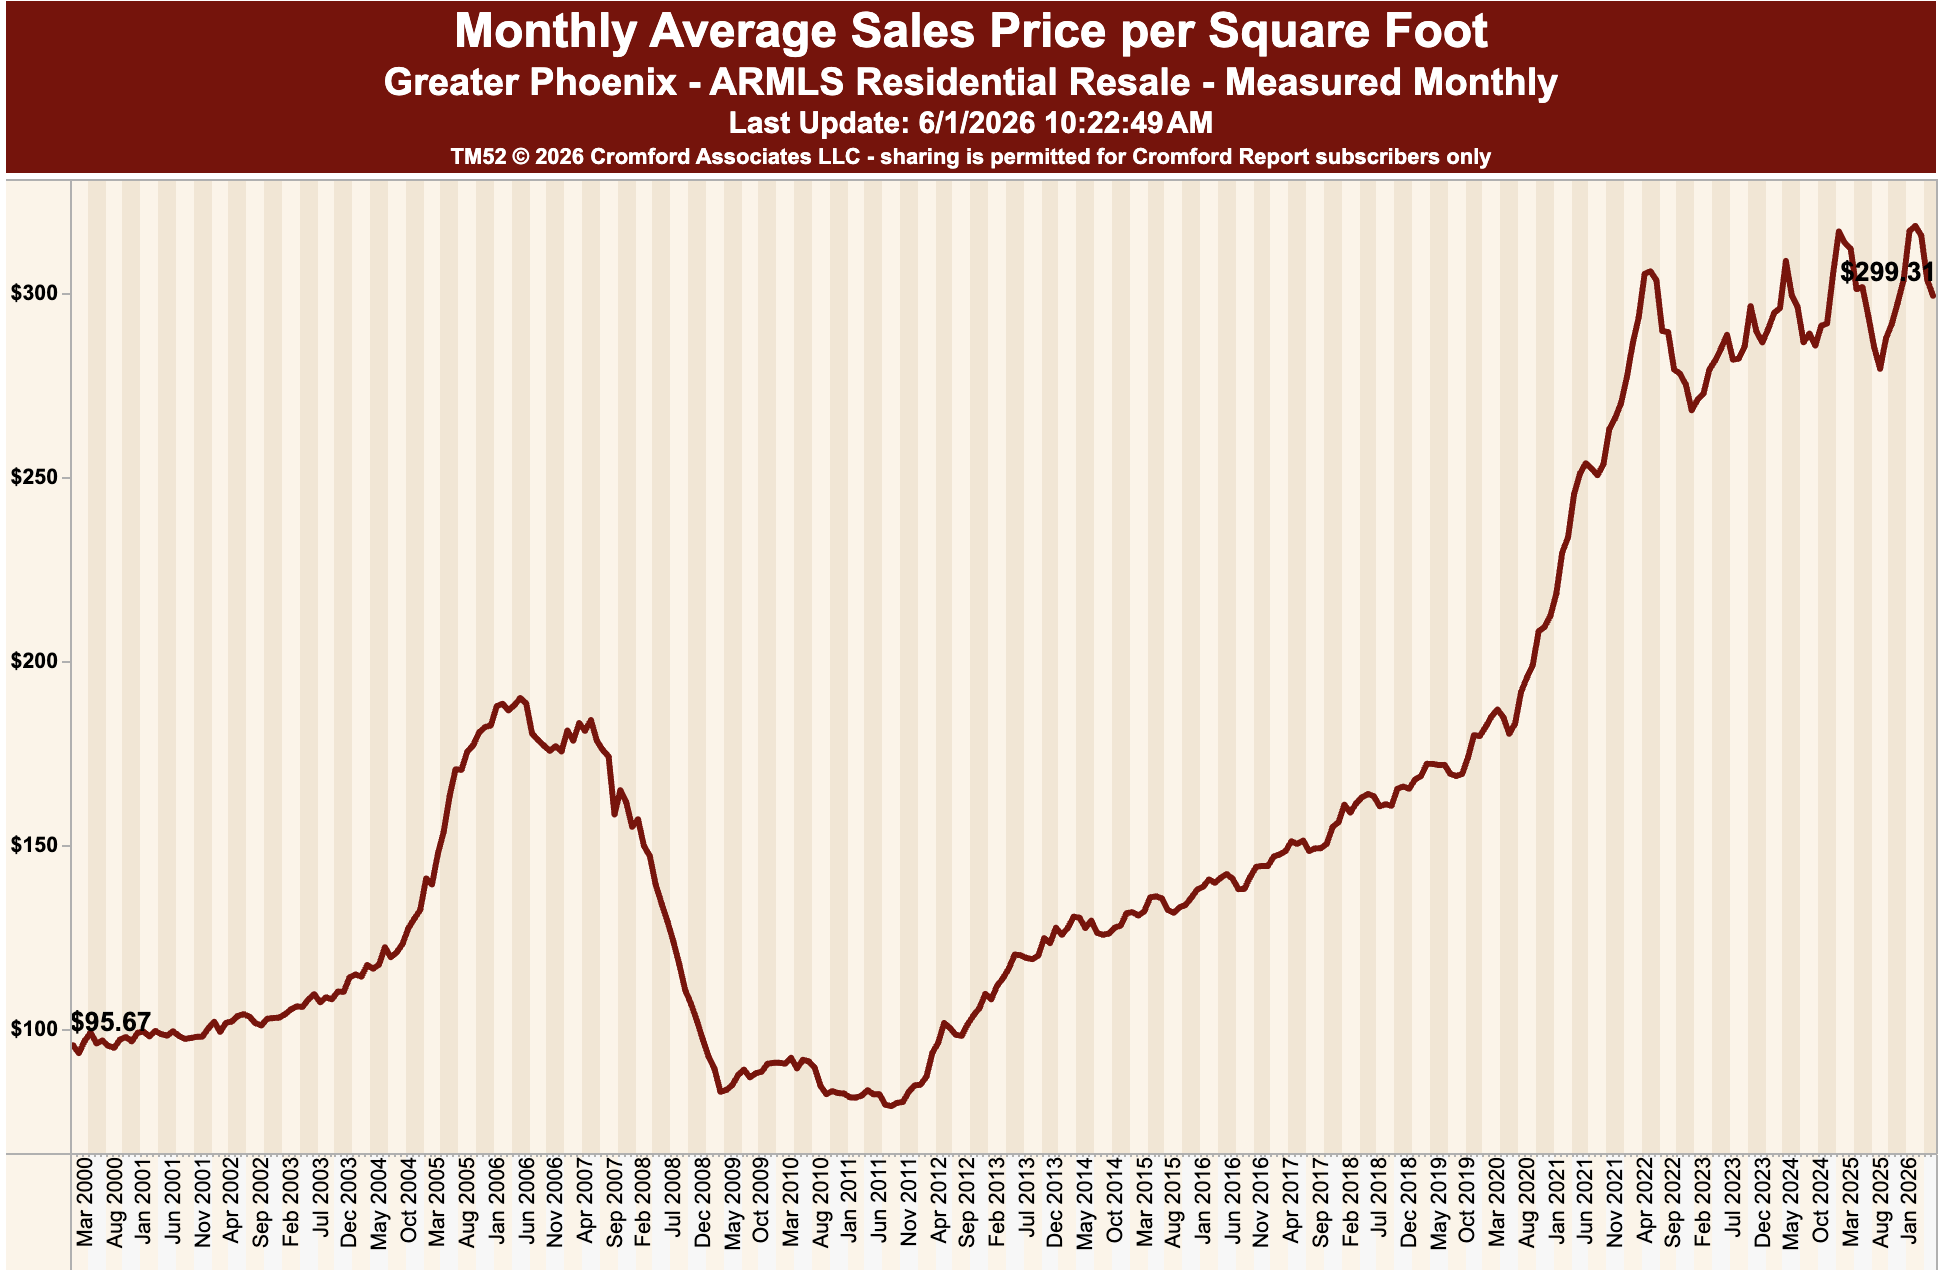
This one covers the same stretch of time as the home-value chart up top — and that's where it gets interesting.
Back in the 2003-to-2008 run, the money supply barely budged. Home values climbed anyway, on the back of loose credit, and we all know how that ended — it just wasn't built on anything that could hold.
The COVID run-up was a different animal. Values shot up because demand exploded under those low, low, low interest rates — and this time the money supply in the country climbed right alongside them. Almost in lockstep. Both peaked in April of 2022, both eased off afterward, and both have been trending back up since. It makes me wonder if that's the reason this jump has held on for more than six years now, when the last one couldn't.
So — when are they coming down?
What goes up must come down. I believe that, I do. Knowing the when is the whole magic trick, and the honest truth is that timing the market almost perfectly is next to impossible. That's why I keep coming back to this money-supply chart — I'm genuinely curious whether you think it's a fair piece of the puzzle for why values have stayed up.
Because here's my hunch: ask yourself what it would actually take to pull that money supply back down. Whatever the answer is, I'd bet a real dip in home values is going to be standing pretty close to it.
Hold the phone — foreclosures are climbing?
Now that deserves its own conversation. More on it in my next article.